Real Estate News You Can Use

You’ll find our blog to be a wealth of information, covering everything from local market statistics and home values to community happenings. That’s because we care about the community and want to help you find your place in it. Please reach out if you have any questions at all. We’d love to talk with you!

July 18, 2023

Home Prices Are Rebounding

If you’re following the news today, you may feel a bit unsure about what’s happening with home prices and fear whether or not the worst is yet to come. That’s because today’s headlines are painting an unnecessarily negative picture. If we take a year-over-year view, home prices did drop some, but that’s because we’re comparing to a ‘unicorn’ year when prices peaked well beyond the norm.

To avoid an unfair comparison to that previous peak, we need to look at monthly data. And that tells a very different and much more positive story. While local home price trends still vary by market, here’s what the national data tells us.

The graphs below use recent monthly reports from three sources to show the worst home price declines are already behind us, and prices are appreciating nationally.


Looking at this monthly view, we can see the past year in the housing market can be divided into two parts. In the first half of 2022, home prices were going up, and fast. However, starting in July, prices began to go down (shown in red in the graphs above). By around August or September, the trend started to stabilize. But, looking at the most recent data for early 2023, these graphs also show that prices are going up again.

The fact that all three reports show prices have been going up for three or more straight months is an encouraging sign for the housing market. The month-over-month data indicates a national shift is happening – home prices are rising again.

Craig J. Lazzara, Managing Director at S&P Dow Jones Indices, says this about home price trends:

“If I were trying to make a case that the decline in home prices that began in June 2022 had definitively ended in January 2023, April’s data would bolster my argument.” 

Experts believe one of the reasons prices didn’t crash like some expected is because there aren’t enough available homes for the number of people who want to buy them. Even with today’s mortgage rates, there are more people looking to buy than there are homes available for sale.

Mark Fleming, Chief Economist at First American, explains how more demand than supply keeps upward pressure on prices:

“History has shown that higher rates may take the steam out of rising prices, but it doesn’t cause them to collapse entirely. This is especially true in today’s housing market, where the demand for homes continues to outpace supply, keeping the pressure on house prices."

Doug Duncan, Senior VP and Chief Economist at Fannie Mae, states home price growth is exceeding expectations thanks to that high demand:

“. . . housing prices continue to show stronger growth than what was previously expected . . . Housing’s performance is a testimony to the strength of demographic-related demand . . .”

Here’s How This Affects You

  • Buyers: If you've been holding off on buying because you were worried the value of your home would go down, knowing home prices have bounced back should bring you some relief. It also gives you the opportunity to own something that usually becomes more valuable as time goes on.
  • Sellers: If you've been waiting to sell your house because you were concerned about how changing home prices would affect its value, it might be a good idea to team up with a real estate agent to list your house. You don't have to wait any longer because the latest data suggests things are turning in your favor.

Bottom Line

If you delayed your moving plans because you were concerned about home prices dropping, the latest data reveals the worst is already over, and prices are appreciating nationally. Let's get in touch so you know what's happening with home prices in our area.

The information contained, and the opinions expressed, in this article are not intended to be construed as investment advice. Keeping Current Matters, Inc. does not guarantee or warrant the accuracy or completeness of the information or opinions contained herein. Nothing herein should be construed as investment advice. You should always conduct your own research and due diligence and obtain professional advice before making any investment decision. Keeping Current Matters, Inc. will not be liable for any loss or damage caused by your reliance on the information or opinions contained herein.


 

Posted in Buying, Selling
July 3, 2023

Evaluating Your Wants and Needs as a Homebuyer Matters More Today

When it comes to buying a home, especially with today’s affordability challenges, you’ll want to be strategic. Mortgage rates impact how much it costs to borrow money for your home loan. And, to help offset the higher borrowing costs today, some homebuyers are taking a close look at their wish list and re-evaluating what features they really need in their next home to avoid overextending. As a recent NerdWallet article says:

“A pool, for example, may be nice to have, but it may not provide as much day-to-day value as a garage or a space for a home office . . .”

While that pool may be appealing, think twice on whether or not it’s really something you must have to be happy in your next home. Is getting that pool the main reason you’re moving? Probably not. It’s more likely a need for more space, a home office, or proximity to loved ones, friends, or work that’s motivating you to make a change.

So, if you’re looking to buy a home, take some time to consider what’s truly essential for you in your next house. Make a list of all the features you’ll want to see, and from there, work to break those features into categories. Here’s a great way to organize your list:

  • Must-Haves – If a house doesn’t have these features, it won’t work for you and your lifestyle (examples: distance from work or loved ones, number of bedrooms/bathrooms, etc.).
  • Nice-To-Haves – These are features you’d love to have but can live without. Nice-to-haves aren’t dealbreakers, but if you find a home that hits all the must-haves and some of these, it’s a contender (examples: a second home office, a garage, etc.).
  • Dream State – This is where you can really think big. Again, these aren’t features you’ll need, but if you find a home in your budget that has all the must-haves, most of the nice-to-haves, and any of these, it’s a clear winner (examples: a pool, multiple walk-in closets, etc.).

Once you’ve categorized it in a way that works for you, discuss your top priorities with your real estate agent. Remember to think carefully about what’s a non-negotiable for your lifestyle and what’s a nice-to-have that’s more of an added bonus. Be sure to discuss where each feature falls with your agent. They’ll be able to help you refine the list further, coach you through the best way to stick to it, and find a home in your area that meets your top needs.

Bottom Line

Putting together your list of necessary features for your next home might seem like a small task, but it’s a crucial planning step on your homebuying journey today. If you’re ready to find a home that fits your needs, let’s connect.

The information contained, and the opinions expressed, in this article are not intended to be construed as investment advice. Keeping Current Matters, Inc. does not guarantee or warrant the accuracy or completeness of the information or opinions contained herein. Nothing herein should be construed as investment advice. You should always conduct your own research and due diligence and obtain professional advice before making any investment decision. Keeping Current Matters, Inc. will not be liable for any loss or damage caused by your reliance on the information or opinions contained herein.

 

Posted in Buying
July 3, 2023

Less Equity Doesn’t Mean Low Equity

Less equity doesn’t mean low equity – don’t let the negative headlines hold you back. Let’s connect if you’re looking to make a move.


Posted in Selling
July 3, 2023

What Homebuyers Need To Know About Credit Scores

If you’re thinking about buying a home, you should know your credit score’s a critical piece of the puzzle when it comes to qualifying for a home loan. Lenders review your credit to assess your ability to make payments on time, to pay back debts, and more. It’s also a factor that helps determine your mortgage rate. An article from Bankrate explains:

 “Your credit score is one of the most important factors lenders consider when you apply for a mortgage. Not just to qualify for the loan itself, but for the conditions: Typically, the higher your score, the lower the interest rates and better terms you’ll qualify for.”

This means your credit score may feel even more important to your homebuying plans right now since mortgage rates are a key factor in affordability, especially today. According to the Federal Reserve Bank of New York, the median credit score in the U.S. for those taking out a mortgage is 765. But, that doesn’t mean your credit score has to be perfect. An article from Business Insider explains generally how your FICO score range can make an impact:

“. . . you don't need a perfect credit score to buy a house. . . . Aiming to get your credit score in the ‘Good’ range (670 to 739) would be a great start towards qualifying for a mortgage. But if you're wanting to qualify for the lowest rates, try to get your score within the ‘Very Good’ range (740 to 799).” 

Working with a trusted lender’s the best way to get more information on how your credit score could factor into your home loan and the mortgage rate you’re able to get. As FICO says:

“While many lenders use credit scores like FICO Scores to help them make lending decisions, each lender has its own strategy, including the level of risk it finds acceptable. There is no single "cutoff score" used by all lenders and there are many additional factors that lenders may use to determine your actual interest rates.”

If you’re looking for ways to improve your score, Experian highlights some things you may want to focus on:

  • Your Payment History: Late payments can have a negative impact by dropping your score. Focus on making payments on time and paying any existing late charges quickly.
  • Your Debt Amount (relative to your credit limits): When it comes to your available credit amount, the less you’re using, the better. Focus on keeping this number as low as possible.
  • Credit Applications: If you’re looking to buy, don’t apply for other credit. When you apply for new credit, it could result in a hard inquiry on your credit that drops your score.

When you’re ready to start the homebuying process, a lender will be able to assess which range your score falls in and tell you more about the specifics for each loan type.

Bottom Line

With affordability challenges today, prioritizing ways you can have a positive impact on your credit score could help you get a better mortgage rate. If you want to learn more, let’s connect.

The information contained, and the opinions expressed, in this article are not intended to be construed as investment advice. Keeping Current Matters, Inc. does not guarantee or warrant the accuracy or completeness of the information or opinions contained herein. Nothing herein should be construed as investment advice. You should always conduct your own research and due diligence and obtain professional advice before making any investment decision. Keeping Current Matters, Inc. will not be liable for any loss or damage caused by your reliance on the information or opinions contained herein.


Posted in Buying
July 3, 2023

Lending Standards Are Not Like They Were Leading Up to the Crash

You might be worried we’re heading for a housing crash, but there are many reasons why this housing market isn’t like the one we saw in 2008. One of which is how lending standards are different today. Here’s a look at the data to help prove it. 

Every month, the Mortgage Bankers Association (MBA) releases the Mortgage Credit Availability Index (MCAI). According to their website:

“The MCAI provides the only standardized quantitative index that is solely focused on mortgage credit. The MCAI is . . . a summary measure which indicates the availability of mortgage credit at a point in time.”

Basically, the index determines how easy it is to get a mortgage. Take a look at the graph below of the MCAI since they started keeping track of this data in 2004. It shows how lending standards have changed over time. It works like this: 

  • When lending standards are less strict, it’s easier to get a mortgage, and the index (the green line in the graph) is higher.
  • When lending standards are stricter, it’s harder to get a mortgage, and the line representing the index is lower.

In 2004, the index was around 400. But, by 2006, it had gone up to over 850. Today, the story is quite different. Since the crash, the index went down because lending standards got tighter, so today it’s harder to get a mortgage.

Loose Lending Standards Contributed to the Housing Bubble

One of the main factors that contributed to the housing bubble was that lending standards were a lot less strict back then. Realtor.com explains it like this: 

“In the early 2000s, it wasn’t exactly hard to snag a home mortgage. . . . plenty of mortgages were doled out to people who lied about their incomes and employment, and couldn’t actually afford homeownership.” 

The tall peak in the graph above indicates that leading up to the housing crisis, it was much easier to get credit, and the requirements for getting a loan were far from strict. Back then, credit was widely available, and the threshold for qualifying for a loan was low.

Lenders were approving loans without always going through a verification process to confirm if the borrower would likely be able to repay the loan. That means creditors were lending to more borrowers who had a higher risk of defaulting on their loans.

Today’s Loans Are Much Tougher To Get than Before

As mentioned, lending standards have changed a lot since then. Bankrate describes the difference: 

“Today, lenders impose tough standards on borrowers – and those who are getting a mortgage overwhelmingly have excellent credit.”

If you look back at the graph, you’ll notice after the peak around the time of the housing crash, the line representing the index went down dramatically and has stayed low since. In fact, the line is far below where standards were even in 2004 – and it’s getting lower. Joel Kan, VP and Deputy Chief Economist at MBA, provides the most recent update from May:

“Mortgage credit availability decreased for the third consecutive month . . . With the decline in availability, the MCAI is now at its lowest level since January 2013.”

The decreasing index suggests standards are getting much tougher – which makes it clear we’re far away from the extreme lending practices that contributed to the crash.

Bottom Line

Leading up to the housing crash, lending standards were much more relaxed with little evaluation done to measure a borrower’s potential to repay their loan. Today, standards are tighter, and the risk is reduced for both lenders and borrowers. This goes to show, these are two very different housing markets, and this market isn’t like the last time.

The information contained, and the opinions expressed, in this article are not intended to be construed as investment advice. Keeping Current Matters, Inc. does not guarantee or warrant the accuracy or completeness of the information or opinions contained herein. Nothing herein should be construed as investment advice. You should always conduct your own research and due diligence and obtain professional advice before making any investment decision. Keeping Current Matters, Inc. will not be liable for any loss or damage caused by your reliance on the information or opinions contained herein.

 

Posted in Buying, Selling
July 3, 2023

Where Will You Go If You Sell? Newly Built Homes Might Be the Answer.

Do you want to sell your house, but hesitate because you’re worried you won’t be able to find your next home in today’s market? You're not alone, but there’s some good news that may ease your worries. New home construction is up and is becoming an increasingly significant part of the housing inventory.

That means when you go to put your house on the market this summer, considering newly built homes is crucial for expanding the options you’ll have for your next move.

Near-Record Percentage of New Home Inventory

Newly built homes today make up a near-record percentage of the total number of homes available for sale (see graph below):

In fact, as the data shows, newly built homes now make up 31% of the total for-sale inventory. Over the past couple of decades, newly built homes made up an average of only around 13% of total housing inventory from 1983 to 2019.

That means the percentage of the total available homes that are newly built is over two times higher than the norm.

Why This Matters to You 

Overall, the supply of homes for sale is still low. And when there’s limited supply, it’s crucial to explore all of your available choices. New-home construction has emerged as a game changer with increasing inventory. Not to mention, recent data shows it’s gaining even more momentum as more newly built homes are underway and will be coming to the market in the months ahead.

Robert Dietz, Chief Economist at the National Association of Home Builders (NAHB), highlights the importance of newly built homes for those looking to buy in today’s housing market. Dietz states:

"With limited available housing inventory, new construction will continue to be a significant part of prospective buyers' search in the quarters ahead."

Don’t overlook this growing market segment and risk missing out on great opportunities to find your ideal home. Since new home construction accounts for roughly 31% of total for sale inventory, you could be cutting nearly one in three options from your search if you don’t consider newly built homes. 

If you’re looking to make a move, a local real estate agent can help you sell your current house and explore newly built options in your area. They have the expertise you need to handle both sides of the process so you can move out of your current house and into your brand-new dream home.

Bottom Line

Now’s the time to sell your house and take advantage of the momentum that’s building in new home construction. Let’s connect so you have a guide throughout the selling and buying process. Together, we can make your transition to a newly built home a reality.

The information contained, and the opinions expressed, in this article are not intended to be construed as investment advice. Keeping Current Matters, Inc. does not guarantee or warrant the accuracy or completeness of the information or opinions contained herein. Nothing herein should be construed as investment advice. You should always conduct your own research and due diligence and obtain professional advice before making any investment decision. Keeping Current Matters, Inc. will not be liable for any loss or damage caused by your reliance on the information or opinions contained herein.


Posted in Buying, Selling
June 16, 2023

The Main Reason Mortgage Rates Are So High

Today’s mortgage rates are top-of-mind for many homebuyers right now. As a result, if you’re thinking about buying for the first time or selling your current house to move into a home that better fits your needs, you may be asking yourself these two questions: 

  1. Why Are Mortgage Rates So High?
  2. When Will Rates Go Back Down?

Here’s context you need to help answer those questions.

1. Why Are Mortgage Rates So High? 

The 30-year fixed-rate mortgage is largely influenced by the supply and demand for mortgage-backed securities (MBS). According to Investopedia

“Mortgage-backed securities (MBS) are investment products similar to bonds. Each MBS consists of a bundle of home loans and other real estate debt bought from the banks that issued them . . . The investor who buys a mortgage-backed security is essentially lending money to home buyers.”

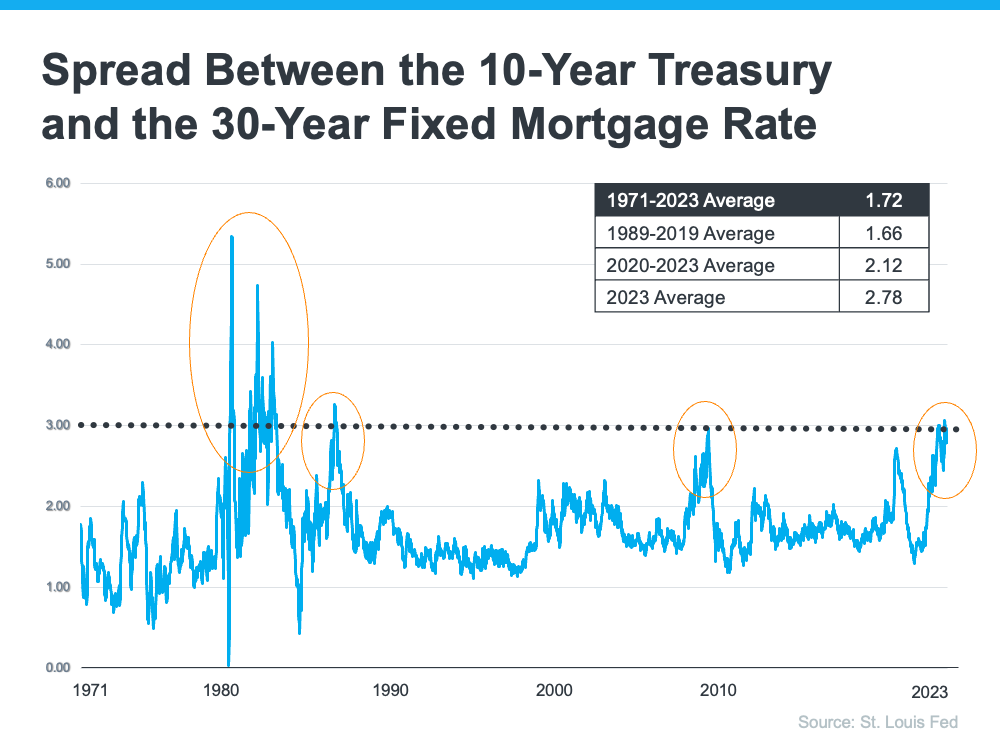
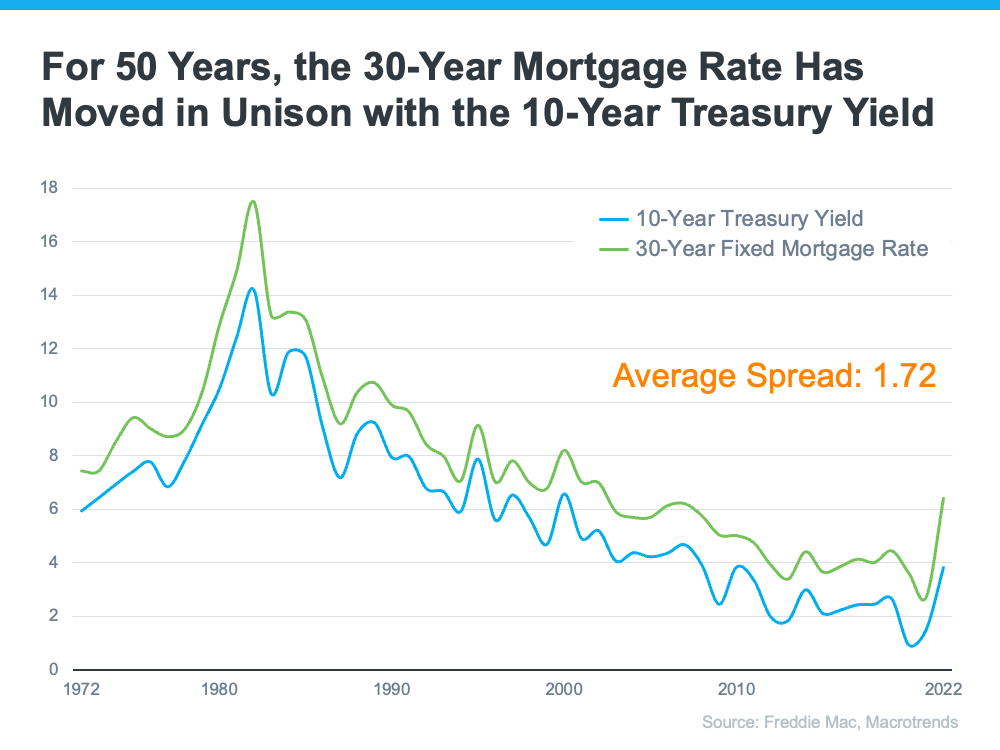
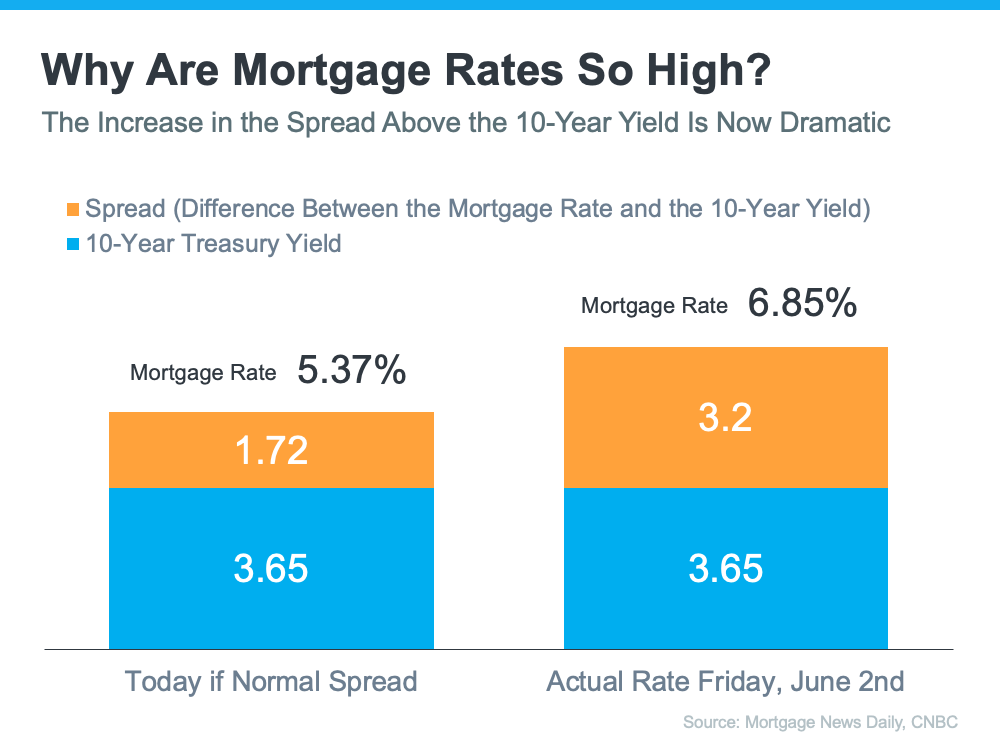
Demand for MBS helps determine the spread between the 10-Year Treasury Yield and the 30-year fixed mortgage rate. Historically, the average spread between the two is 1.72 (see chart below):

Last Friday morning, the mortgage rate was 6.85%. That means the spread was 3.2%, which is almost 1.5% over the norm. If the spread was at its historical average, mortgage rates would be 5.37% (3.65% 10-Year Treasury Yield + 1.72 spread).

This large spread is very unusual. As George Ratiu, Chief Economist at Keeping Current Matters (KCM), explains:

“The only times the spread approached or exceeded 300 basis points were during periods of high inflation or economic volatility, like those seen in the early 1980s or the Great Financial Crisis of 2008-09."

The graph below uses historical data to help illustrate this point by showing the few times the spread has increased to 300 basis points or more:

The graph shows how the spread has come down after each peak. The good news is, that means there’s room for mortgage rates to improve today.

So, what’s causing the larger spread and making mortgage rates so high today?

The demand for MBS is heavily influenced by the risks associated with investing in them. Today, that risk is impacted by broader market conditions like inflation and fear of a potential recession, the Fed’s interest rate hikes to try to bring down inflation, headlines that create unnecessarily negative narratives about home prices, and more.

Simply put: when there’s less risk, demand for MBS is high, so mortgage rates will be lower. On the other hand, if there’s more risk with MBS, demand for MBS will be low, and we’ll see higher mortgage rates as a result. Currently, demand for MBS is low, so mortgage rates are high.

2. When Will Rates Go Back Down?

Odeta Kushi, Deputy Chief Economist at First American, answers that question in a recent blog:

“It’s reasonable to assume that the spread and, therefore, mortgage rates will retreat in the second half of the year if the Fed takes its foot off the monetary tightening pedal and provides investors with more certainty. However, it’s unlikely that the spread will return to its historical average of 170 basis points, as some risks are here to stay.”

Bottom Line

The spread will shrink when the fear investors feel is eased. That’ll mean we should see mortgage rates moderate as the year goes on. However, when it comes to forecasting mortgage rates, no one can know for sure exactly what will happen.

The information contained, and the opinions expressed, in this article are not intended to be construed as investment advice. Keeping Current Matters, Inc. does not guarantee or warrant the accuracy or completeness of the information or opinions contained herein. Nothing herein should be construed as investment advice. You should always conduct your own research and due diligence and obtain professional advice before making any investment decision. Keeping Current Matters, Inc. will not be liable for any loss or damage caused by your reliance on the information or opinions contained herein.

 

Posted in Buying, Selling
June 16, 2023

Are Home Prices Going Up or Down? That Depends…

Media coverage about what’s happening with home prices can be confusing. A large part of that is due to the type of data being used and what they’re choosing to draw attention to. For home prices, there are two different methods used to compare home prices over different time periods: year-over-year (Y-O-Y) and month-over-month (M-O-M). Here's an explanation of each. 

Year-over-Year (Y-O-Y):
  • This comparison measures the change in home prices from the same month or quarter in the previous year. For example, if you're comparing Y-O-Y home prices for April 2023, you would compare them to the home prices for April 2022.
  • Y-O-Y comparisons focus on changes over a one-year period, providing a more comprehensive view of long-term trends. They are usually useful for evaluating annual growth rates and determining if the market is generally appreciating or depreciating.
Month-over-Month (M-O-M):
  • This comparison measures the change in home prices from one month to the next. For instance, if you're comparing M-O-M home prices for April 2023, you would compare them to the home prices for March 2023.
  • Meanwhile, M-O-M comparisons analyze changes within a single month, giving a more immediate snapshot of short-term movements and price fluctuations. They are often used to track immediate shifts in demand and supply, seasonal trends, or the impact of specific events on the housing market.

The key difference between Y-O-Y and M-O-M comparisons lies in the time frame being assessed. Both approaches have their own merits and serve different purposes depending on the specific analysis required.

Why Is This Distinction So Important Right Now? 

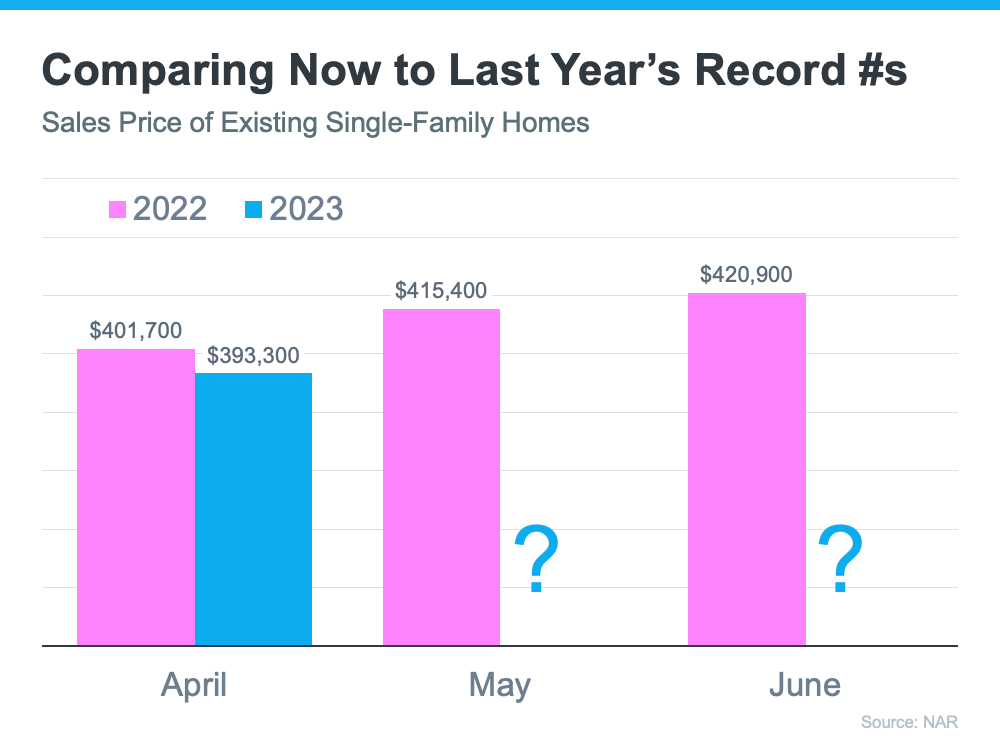
We’re about to enter a few months when home prices could possibly be lower than they were the same month last year. April, May, and June of 2022 were three of the best months for home prices in the history of the American housing market. Those same months this year might not measure up. That means, the Y-O-Y comparison will probably show values are depreciating. The numbers for April seem to suggest that’s what we’ll see in the months ahead (see graph below):

That’ll generate troubling headlines that say home values are falling. That’ll be accurate on a Y-O-Y basis. And, those headlines will lead many consumers to believe that home values are currently cascading downward.

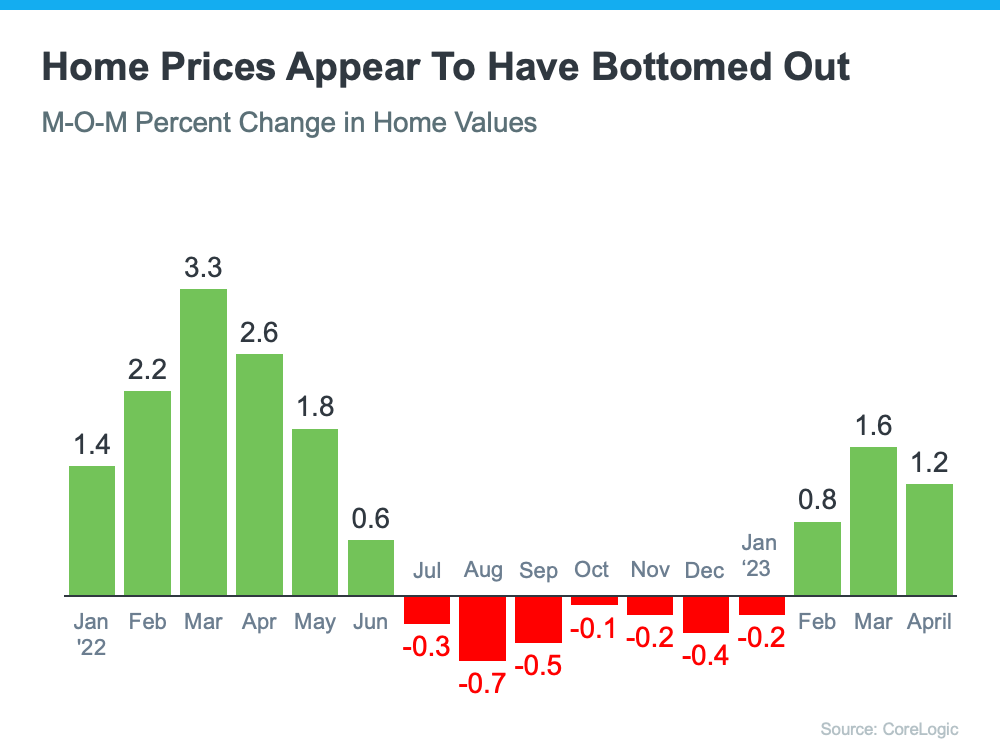
However, on a closer look at M-O-M home prices, we can see prices have actually been appreciating for the last several months. Those M-O-M numbers more accurately reflect what’s truly happening with home values: after several months of depreciation, it appears we’ve hit bottom and are bouncing back.

Here’s an example of M-O-M home price movements for the last 16 months from the CoreLogic Home Price Insights report (see graph below):

Why Does This Matter to You?

So, if you’re hearing negative headlines about home prices, remember they may not be painting the full picture. For the next few months, we’ll be comparing prices to last year’s record peak, and that may make the Y-O-Y comparison feel more negative. But, if we look at the more immediate, M-O-M trends, we can see home prices are actually on the way back up.

There’s an advantage to buying a home now. You’ll buy at a discount from last year’s price and before prices start to pick up even more momentum. It’s called “buying at the bottom,” and that’s a good thing.

Bottom Line

If you have questions about what’s happening with home prices, or if you’re ready to buy before prices climb higher, let’s connect.

The information contained, and the opinions expressed, in this article are not intended to be construed as investment advice. Keeping Current Matters, Inc. does not guarantee or warrant the accuracy or completeness of the information or opinions contained herein. Nothing herein should be construed as investment advice. You should always conduct your own research and due diligence and obtain professional advice before making any investment decision. Keeping Current Matters, Inc. will not be liable for any loss or damage caused by your reliance on the information or opinions contained herein.
 

Posted in Buying, Selling
June 16, 2023

A Drop in Equity Doesn’t Mean Low Equity

You may see media coverage talking about a drop in homeowner equity. What’s important to understand is that equity is tied closely to home values. So, when home prices appreciate, you can expect equity to grow. And when home prices decline, equity does too. Here’s how this has played out recently. 

Home prices rose rapidly during the ‘unicorn’ years. That gave homeowners a considerable equity boost. But those ‘unicorn’ years couldn’t last forever. The market had to moderate at some point, and that’s what we saw last fall and winter. 

As home prices dropped slightly in the back half of 2022, equity was impacted. Based on the most recent report from CoreLogic, there was a 0.7% dip in homeowner equity over the last year. However, the headlines reporting on that change aren’t painting the whole picture. The reality is, while home price depreciation during the second half of last year caused equity to drop, the data shows homeowners still have near record amounts of equity

The graph below helps illustrate this point by looking at the total amount of tappable equity in this country going all the way back to 2005. Tappable equity is the amount of equity available for homeowners to access before hitting a maximum 80% loan-to-value ratio (LTV). As the data shows, there was a significant equity boost during the ‘unicorn’ years as home prices rapidly appreciated (see the pink in the graph below).

But here’s what’s key to realize – even though there’s been a small dip, total homeowner equity is still much higher than it was before the ‘unicorn’ years.

And there’s more good news. Recent home price reports show the worst home price declines are behind us, and prices have started to go up again. As Selma Hepp, Chief Economist at CoreLogic, explains:

“Home equity trends closely follow home price changes. As a result, while the average amount of equity declined from a year ago, it increased from the fourth quarter of 2022, as monthly home prices growth accelerated in early 2023.” 

The last part of that quote is particularly important and is the piece of the puzzle the news is leaving out. To further emphasize the positive turn we’re already seeing, experts say home prices are forecast to appreciate at a more normal rate over the next year. In the same report, Hepp puts it this way:

The average U.S. homeowner now has more than $274,000 in equity – up significantly from $182,000 before the pandemic. Also, while homeowners in some areas of the country who bought a property last spring have no equity as a result of price losses, forecasted home price appreciation over the next year should help many borrowers regain some of that lost equity.”

And even though Odeta Kushi, Deputy Chief Economist at First American, references a slightly different number, Kushi further validates the fact that homeowners have a lot of equity right now: 

“Homeowners today have an average of $302,000 in equity in their homes.”

That means if you’ve owned your home for a few years, you likely still have way more equity than you did before the ‘unicorn’ years. And if you’ve owned your home for a year or less, the forecast for more typical price appreciation over the next year should mean your equity is already on the way back up.

Bottom Line

Context is everything when looking at headlines. While homeowner equity dropped some from last year, it’s still near all-time highs. Let’s connect so you can get the answers you deserve from an expert who’s here to help as you plan your move this year.

The information contained, and the opinions expressed, in this article are not intended to be construed as investment advice. Keeping Current Matters, Inc. does not guarantee or warrant the accuracy or completeness of the information or opinions contained herein. Nothing herein should be construed as investment advice. You should always conduct your own research and due diligence and obtain professional advice before making any investment decision. Keeping Current Matters, Inc. will not be liable for any loss or damage caused by your reliance on the information or opinions contained herein.
 

Posted in Selling
June 16, 2023

Things To Avoid After Applying for a Mortgage

Make sure you’re in the best position when you get to the closing table. Let’s connect so you can learn more about the homebuying process.


Posted in Buying